
3.3.1 Revenue

Revenue 


Total revenue - the income derived from sales of a product over a period of time. Often referred to as turnover. 

TR = P x Q

where Q is quantity sold and P is price sold at
Average revenue - revenue generated per unit of output sold. Found by dividing the TR by Q. 
It is the same as the demand curve

P = AR = TR/Q 

Marginal revenue - the revenue gained in selling an additional unit(s) of output. This is the rate of change of TR (so the gradient and the first differential). 

Image result for marginal revenue formula

Diagrammatic analysis 

Image result for revenue curve

As you can see here, MR is the gradient of TR - where the grad of TR is 0 (the maximum), MR cuts the x-axis. 

MR has a gradient that is double that of AR. 


Elasticity and revenue 


Image result for PED and revenue graph

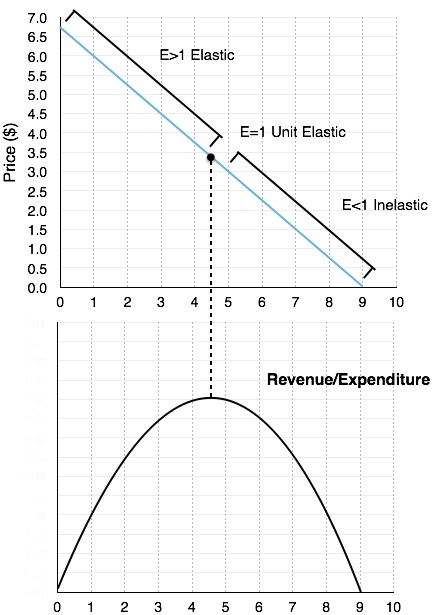
Where demand is price elastic, a fall in price causes a greater than proportionate rise in demand, and revenue increases. Where price is elastic, the firm should price cut in order to increase revenue. 

Where demand is price inelastic, a rise in price causes a less than proportionate fall in demand, so revenue increases. When price is inelastic, the firm should increase prices in order to increase revenue. 

At unit elastic, the firm is revenue maximising - both increasing and decreasing the price would lead to a loss in revenue. So at the midpoint of the AR curve, or where MR = 0, the firm revenue maximises. 

Comments

Popular posts from this blog

Business Growth

Why do businesses grow?  Profit motive Businesses grow to make more profit by increasing revenue. Selling more to more people often means profits increase.  The valuation of a company's share is often influenced by how it is expected to do in the future (ie how much profit it is likely to make). When it is projected to do well, share prices increase, and it is valued more highly on the stock market. This provides incentive for companies to increase profits, doing well on the stock market increases investment and raises more money.  Cost motive - economies of scale When firms are larger, relative costs are smaller. This is because some costs are fixed, so if you are a larger company, producing larger output, the cost per unit will decrease.  e.g. If a T-shirt factory's main cost is the £10,000 to rent to factory each month, and it produces only 1000 shirts a month, each shirt costs £10 to make. But if it scales up and produces 100,000 shirts a month, ...

The Philips curve

The Philips curve  The Philips curve suggests a tradeoff between unemployment and inflation - to decrease unemployment, inflation has to rise. This creates a conflict between two macroeconomic objectives - targeting inflation at 2% (in the UK) and decreasing unemployment. 

3.1.3 Demergers

Demergers   A demerger is the breaking up of a firm into separate firms.  e.g Sports Direct selling off Dunlop in 2016. PepsiCo splitting off foods businesses (KFC, Taco Bell, etc.) into a separate corporation, Yum Brands. Later Yum Brands demerged into Yum China and Yum Brands. Reasons for demergers Diseconomies of scale - the opposite of economies of scale, where average costs begin to rise as output increases. May occur due to it being difficult to retain control on the expanding business - principal-agent problem may arise. Also less co-operation by employees who feel more alienated and as a result less productive - they feel less of a connection to the business.  May also be hard to co-ordinate and communicate between locations and employees when a firm is large. Miscommunication can again lead to costs rising.  To focus on core businesses to streamline costs and improve profits. The firm may have expanded into different markets and expe...