Taxation
Average rate of tax - percentage of an individual's income that goes to the government (so total tax paid/total income x100)
Marginal rate of tax - percentage of tax paid on each additional dollar of income.
Progressive taxes - where the marginal rate of tax rises as the amount subject to taxation rises. For example, income tax. As the amount of income increases, the rate of tax on each additional pound earned goes up, increasing the average rate of tax.
- Good for reducing inequality.
Regressive taxes - where the marginal rate of tax decreases as the amount subject to taxation rises. For example, excise duties (on tobacco/alcohol, etc.) As the amount spent on these goods increases, the rate of tax decreases, as a smaller percentage of the income is spent on tobacco/alcohol. The average rate of tax is lower for those with higher incomes. Therefore these taxes often are of a greater burden to the poorer and may increase inequality.
Proportional taxes - where the tax rate is fixed so that the marginal rate of tax remains constant and so equal to the average rate of tax. For example, National Insurance Contributions (NICs). An increase in income leads to an equivalent percentage increase in tax paid.
More here
Economic effects of changes in tax
Incentive to work
Increasing direct tax rates (e.g income tax) decreases the incentive to work as one will get less on the money they have earned. As income tax is progressive, the more one earns the smaller the proportion of it they receive, so these further reduces the incentive to work.
Decreasing direct tax rates would have the opposite effect. Lower taxes encourage people to work for more hours, increasing productivity. This is the substitution effect - as wages are worth more, work becomes more attractive than leisure. However, this only works up to a point - cut tax rates by too much and you get the income effect. As people have much higher wages it is easier to get the same amount of income by working fewer hours. People don't need to work as much if their work is highly paid.
Increasing/decreasing indirect tax changes the amount of purchasing power a consumer has so impacts on the level of consumption, not so much the level of productivity.
The Laffer Curve
The Laffer Curve shows the relationship between the tax rate and the total tax revenue collected. It suggests that initially an increase in the rate of tax increases the government's tax revenue, but only up to a certain point - the optimal tax rate. Beyond this point the tax revenue the government collects actually goes down.
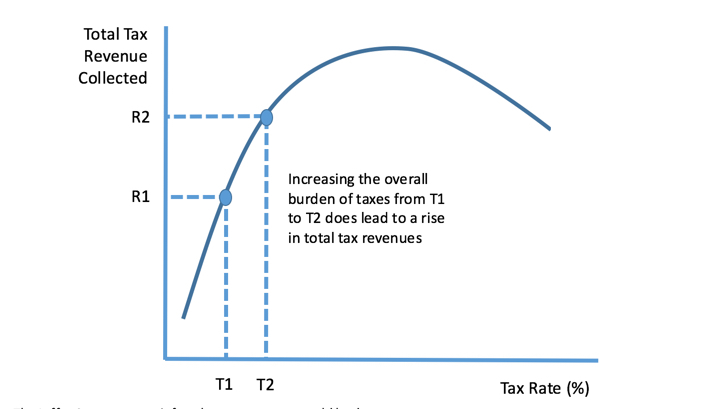 |
| Laffer Curve |
This is due to several factors:
- 'Brain drain' - highly skilled workers leaving the country for another with more favourable tax rates
- Increased tax evasion and/or tax avoidance
- Decreased incentive to work, so as there is less income, less revenue is collected.
Income distribution
Increasing direct taxes promotes equality, as those with a greater income have to pay more, so this revenue can be used to help those with less income. Increasing indirect taxes may promote inequality, as the goods make up a greater proportion of less wealthy people's incomes, so an increase in the price of the good affects them more.
Real output and employment
An increase in direct taxes decreases productivity, thus shifting AS in and decreasing real output (GDP). Note that this also increases the price level -> inflation.
An increase in indirect taxes decreases consumption, this shifting in AD, again decreasing GDP but this time lowering the price level.
Increasing indirect taxes can lead to lower employment as it reduces consumption and so firms take in less money, meaning they have to cut costs and may let go of workers/not hire workers they otherwise would have. On the other hand, the increase can lead to higher employment by the government if their tax revenue increases. These government employees would go on to increase consumption with their wages, leading to greater employment in other businesses.
Price level
Increase in direct taxes decreases the amount of disposable income people have, as they are able to purchase less with their income. An increase in indirect taxes has the same effect in reducing the consumer's purchasing power. This has the effect of reducing consumption and AD, therefore lowering the price level. This can lead to deflation. The opposite (a decrease in taxes) could therefore lead to inflation.
The trade balance
The trade balance is a country's exports minus its imports (X-M).
FDI flows
FDI (Foreign Direct Investment) could increase as taxes increase as higher taxes are a sign of national stability. Firms would be more confident in investing in the country. This increase in investment would shift AD out, increasing GDP.
However, FDI might also decrease as taxes increase as it becomes more expensive to set up a business in the country as higher taxes means higher costs of production for firms. The investment might instead go to a country with lower taxes.
Comments
Post a Comment