
3.3.4 Normal profits, supernormal profits and losses

Normal profits, supernormal profits and losses 

Profit maximisation 

Occurs at:

MC = MR 

where MC cuts MR from below (as where it cuts from above is point of profit minimisation) 

This is because past this point MR < MC, and each additional good is costing the firm more than it is making. Before that point MR > MC so the firm can increase profit by producing more. 

NB - point of prof max can be found using TC and TR: 
Image result for tc tr

Normal and supernormal profit and lossesImage result for supernormal profit


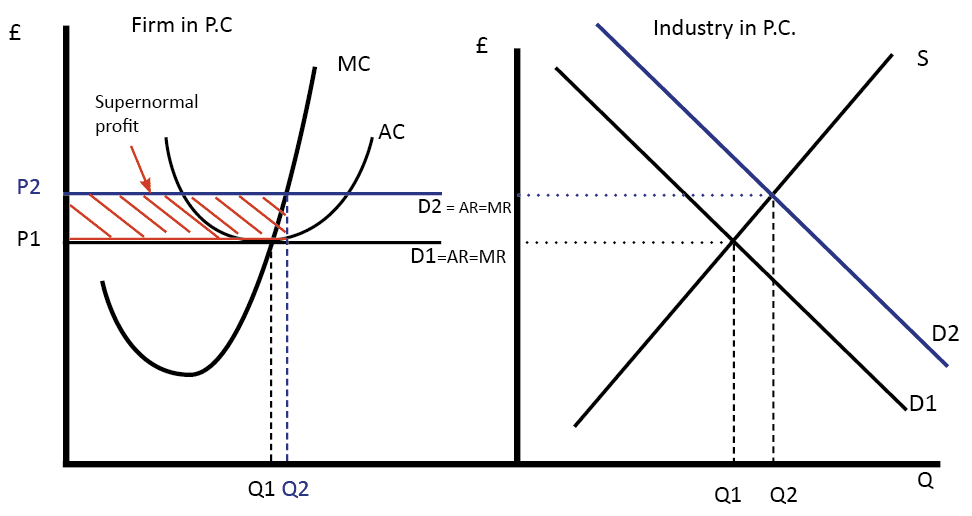
Normal profit is profit that covers the opportunity cost of capital and is just sufficient to keep the firm in the market. 

Supernormal/economic profit are profits that exceed normal profits. 

When AC lies below AR at the point of output, the difference between AR and AC is the supernormal profit on that unit output. The overall supernormal profit is the difference times the quantity sold (Q2 in the above). 

Likewise, when AC lies above AR at the point of output, the company makes supernormal losses. 

SR and LR shut-down prices: diagrammatic analysis 

The SR shut-down condition is where 

AR < AVC 

because fixed costs are sunk costs, and were a firm to shut down it would not be able to recover these costs. So as long as it can cover its variable costs in the SR, it can pay off FC later on rather than shutting down and being unable to recover them. 


The LR shut-down condition is where: 

AR < LRAC 

as in the LR all FoPs are variable. 

Comments

Popular posts from this blog

Business Growth

Why do businesses grow?  Profit motive Businesses grow to make more profit by increasing revenue. Selling more to more people often means profits increase.  The valuation of a company's share is often influenced by how it is expected to do in the future (ie how much profit it is likely to make). When it is projected to do well, share prices increase, and it is valued more highly on the stock market. This provides incentive for companies to increase profits, doing well on the stock market increases investment and raises more money.  Cost motive - economies of scale When firms are larger, relative costs are smaller. This is because some costs are fixed, so if you are a larger company, producing larger output, the cost per unit will decrease.  e.g. If a T-shirt factory's main cost is the £10,000 to rent to factory each month, and it produces only 1000 shirts a month, each shirt costs £10 to make. But if it scales up and produces 100,000 shirts a month, ...

The Philips curve

The Philips curve  The Philips curve suggests a tradeoff between unemployment and inflation - to decrease unemployment, inflation has to rise. This creates a conflict between two macroeconomic objectives - targeting inflation at 2% (in the UK) and decreasing unemployment. 

3.1.3 Demergers

Demergers   A demerger is the breaking up of a firm into separate firms.  e.g Sports Direct selling off Dunlop in 2016. PepsiCo splitting off foods businesses (KFC, Taco Bell, etc.) into a separate corporation, Yum Brands. Later Yum Brands demerged into Yum China and Yum Brands. Reasons for demergers Diseconomies of scale - the opposite of economies of scale, where average costs begin to rise as output increases. May occur due to it being difficult to retain control on the expanding business - principal-agent problem may arise. Also less co-operation by employees who feel more alienated and as a result less productive - they feel less of a connection to the business.  May also be hard to co-ordinate and communicate between locations and employees when a firm is large. Miscommunication can again lead to costs rising.  To focus on core businesses to streamline costs and improve profits. The firm may have expanded into different markets and expe...