
Subsidies

Subsidies 

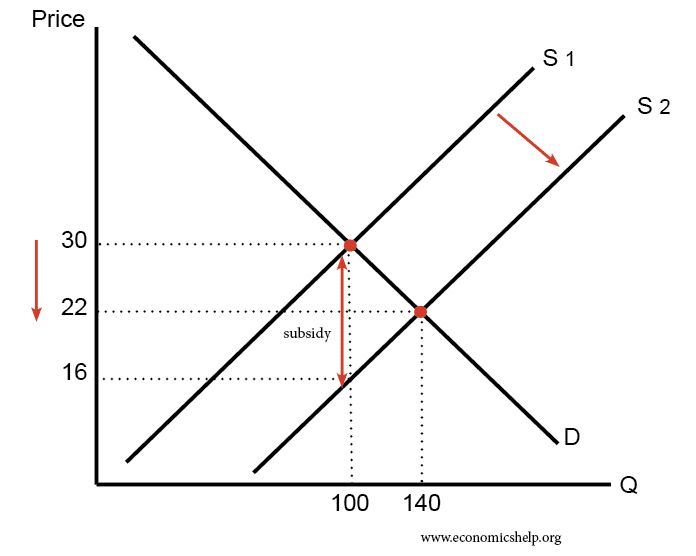
A subsidy is a grant (usually provided by the government) to encourage producers to increase the production of a good or service, resulting to a reduction in its price. The subsidy is usually paid directly to the producers, reducing their costs of production and therefore creating producer benefit. Some of this benefit is passed onto the consumer as the price of the good or service is lowered as the quantity produced increases. The supply curve shifts out because of the increase in production. 

Image result for subsidy diagram
Subsidy

As with taxes, the distribution of consumer and producer benefit depends on the PED and PES of the good or service. In the case of inelastic PED, the price of the good is markedly reduced, meaning there is greater benefit for the consumer. Conversely, the more elastic the PED, the more the producer is able to benefit from the subsidy by keeping more of it. The area between 30 and 16 on the above diagram marks the total government expenditure on the subsidy. 


Comments

Popular posts from this blog

Output gaps and the business cycle

Output gaps and the business cycle The fluctuation of real GDP around an underlying trend is a phenomenon known as the business cycle.  Output gap  - difference between the actual output of an economy and its potential output.  There are two types of output gap, trend and  potential.  Trend growth is the estimated rate of growth of an economy.  Trend output gaps:  Business cycle diagram A negative trend output gap is when real GDP is below trend GDP. The economy is producing below its trend.  e.g If real GDP is £1.8 trillion and trend GDP is £2 trillion then the negative output gap is £0.2 trillion.  Here the economy is in a bust  period. This is characterised by an expansion in GDP, high employment and high confidence. Price levels often rise, meaning inflation occurs.  A positive trend output gap is when real GDP is above trend GDP.  Here the economy is in a recession  (bust). This is characterised by a contraction in GDP, high unemployment and lo

3.4.1 Efficiency

Efficiency   Allocative efficiency  Output at which the marginal utility, or benefit, of a good to a consumer is the same as equal to the marginal cost of producing it.  This is seen on demand/supply curves, where D = S, output is produced as demand = marginal utility and supply = the sum of firms' marginal costs in an industry. On an individual scale, it is where:  AR = MC  Output is where the demand curve cuts the MC curve.   NB: technically occurs where MSB = MSC (if you consider externalities)  Occurs in perfect competition.  Eval - PC markets achieve allocative efficiency where there are no externalities.  LR equilibrium is where P = MPC, so if MSC > MPC, then there is an allocative inefficiency which leads to overproduction and consumption.  Productive efficiency  Output at which a good is produced at the  lowest possible average cost for a firm. This occurs at the minimum point of the AC curve.  AC = MC at this point, because w

3.3.4 Normal profits, supernormal profits and losses

Normal profits, supernormal profits and losses  Profit maximisation  Occurs at: MC = MR  where MC cuts MR from below (as where it cuts from above is point of profit minimisation)  This is because past this point MR < MC , and each additional good is costing the firm more than it is making. Before that point MR > MC so the firm can increase profit by producing more.  NB - point of prof max can be found using TC and TR:  Normal and supernormal profit and losses Normal profit is profit that covers the opportunity cost of capital and is just sufficient to keep the firm in the market.  Supernormal/economic profit are profits that exceed normal profits.  When AC lies below AR at the point of output, the difference between AR and AC is the supernormal profit on that unit output. The overall supernormal profit is the difference times the quantity sold (Q2 in the above).  Likewise, when AC lies above AR at the point of output, the company makes s