Output gaps and the business cycle
The fluctuation of real GDP around an underlying trend is a phenomenon known as the business cycle.
Output gap - difference between the actual output of an economy and its potential output.
There are two types of output gap, trend and potential.
Trend growth is the estimated rate of growth of an economy.
Trend output gaps:
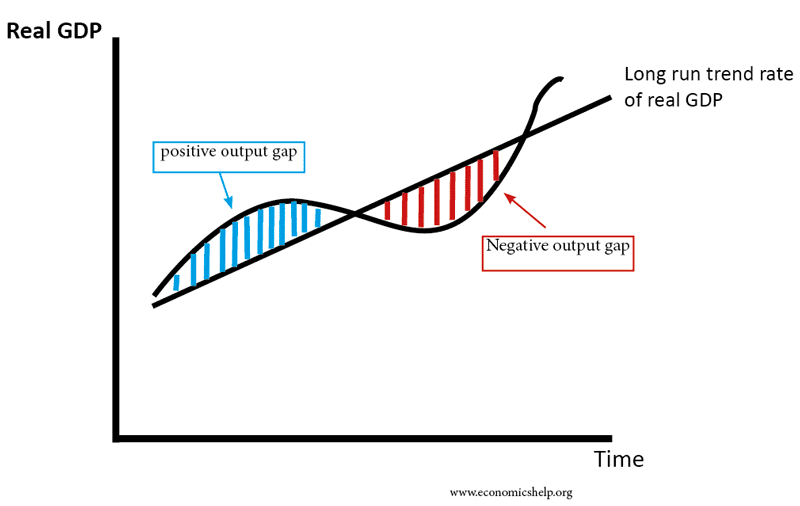 |
| Business cycle diagram |
A negative trend output gap is when real GDP is below trend GDP. The economy is producing below its trend.
e.g If real GDP is £1.8 trillion and trend GDP is £2 trillion then the negative output gap is £0.2 trillion.
Here the economy is in a bust period. This is characterised by an expansion in GDP, high employment and high confidence. Price levels often rise, meaning inflation occurs.
A positive trend output gap is when real GDP is above trend GDP. Here the economy is in a recession (bust). This is characterised by a contraction in GDP, high unemployment and low confidence. Price levels also tend to fall in a recession.
Potential output gaps:
A potential output gap is when real GDP differs from maximum potential GDP. Maximum potential GDP is GDP if the economy were using all its resources to maximum efficiency. On the whole, this is always going to be negative as we will be producing less output than our maximum potential output. Some economists argue that you could still have a positive potential output gap for a short period of time where factors of production are being used beyond full capacity (e.g workers working overtime).
 |
| Output gaps on an AS/AD diagram |
Potential output gaps can also be shown on a PPF diagram. The distance from a point to the PPF is the size of the output gap. If the point is beyond the PPF, this is a positive output gap and if it is within the PPF this is a negative output gap.
Difficulties in measuring output gaps:
It is hard to measure the potential GDP of an economy as it is not something we can observer directly. Therefore it is hard to estimate the output gap. Reasons behind this include:
- Difficulties may arise in estimating the trend GDP.
- Data isn't always reliable and extrapolating data may lead to uncertainties.
- Inaccurate data regarding the labour force.
- Gaps in knowledge about how much firms are investing and potential output from new capital (e.g tech)
- Hard to measure underemployment in the labour market.
Comments
Post a Comment