
Measuring inequality

Lorenz Curve and Gini Coefficient 


Image result for lorenz curve

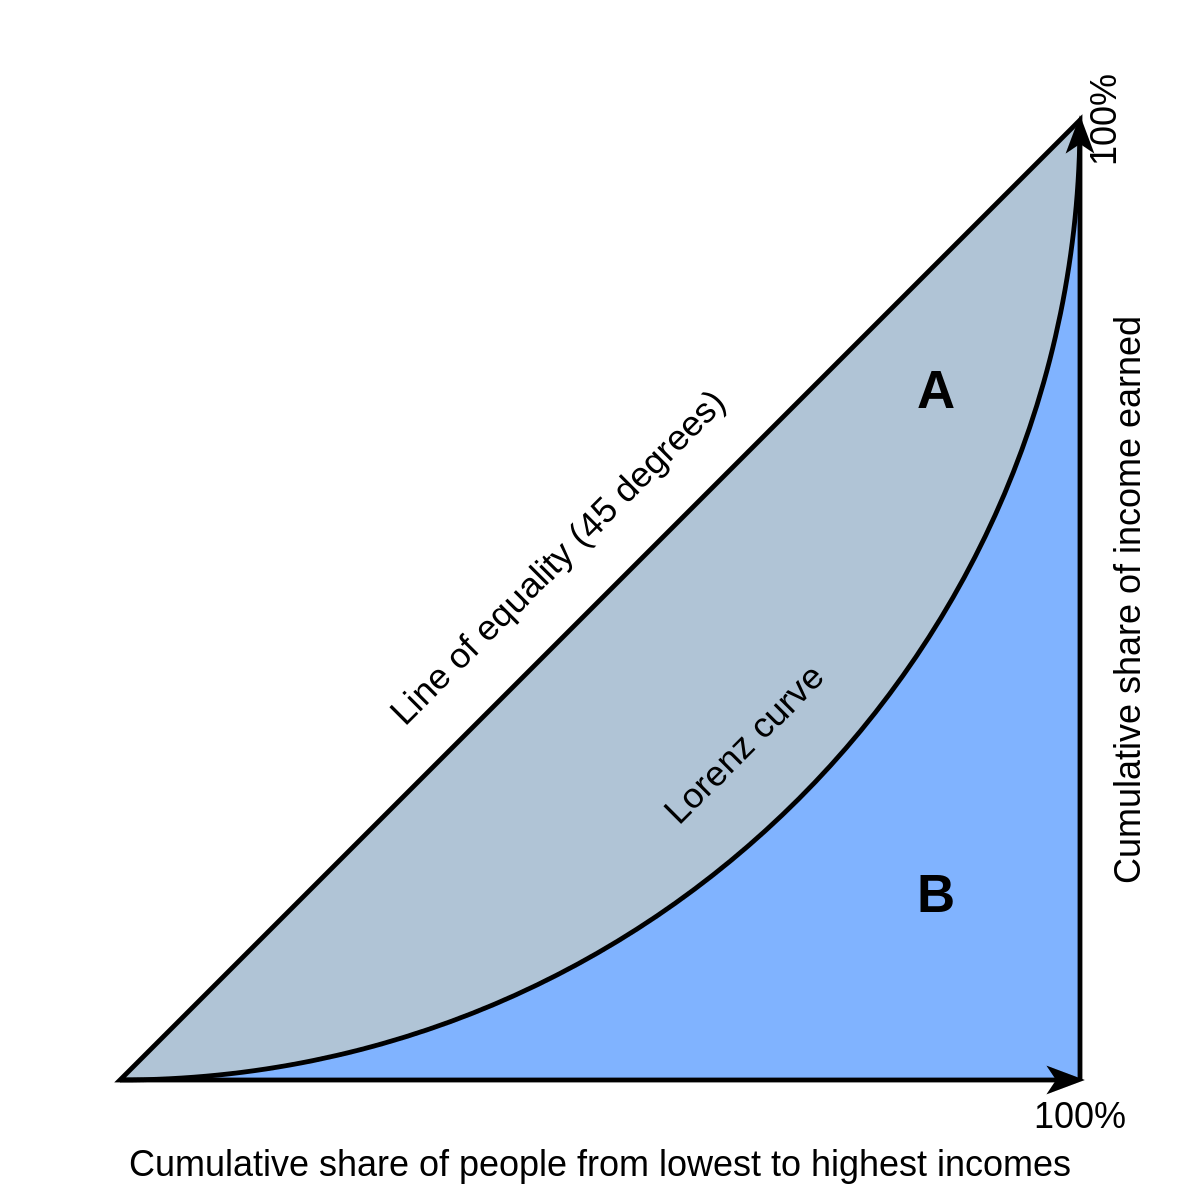
The Lorenz Curve illustrates the distribution of incomes in a country. The Line of Equality represents a country where there is perfect equality - each member would receive the exact same income. The closer the Lorenz Curve is to the Line of Equality, the higher the income equality of that country. The further away from the Line of Equality, the lower the income equality. 


The Gini Coefficient indicates how unequal a society is. It indicates how far the Lorenz Curve is from the Line of Equality. It is good for comparing several countries to one another as it is quantitative, but doesn't give as much information as the Lorenz curve does, as it leaves out the distribution of income. It is calculated using the above formula. 

G = A/A+B

It always lies between 0 to 1, where 0 is perfect equality, where everyone gets the same amount, and 1 is perfect inequality, where one person has all the income and everyone else gets nothing. 

Laffer curve

Image result for laffer curve

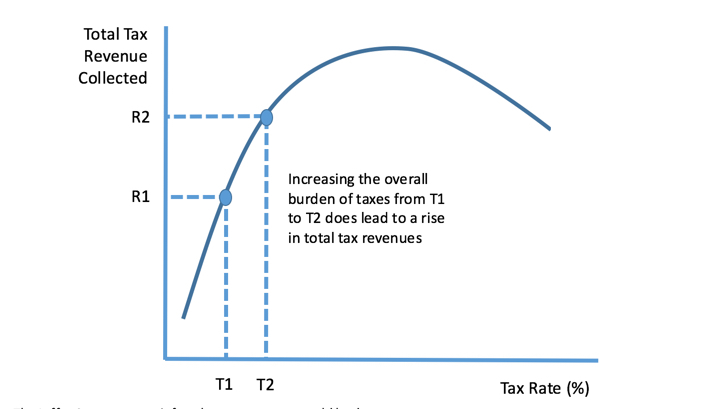
The Laffer Curve depicts the relationship between rates of taxation and the revenue the government receives in tax. It is a parabola, because past a certain point, higher taxation rates means that there is a lack of incentive to work more, as you are not receiving much of the money you have worked for. Therefore people work less, or find a way to evade high taxes, and there for the government collects less money in tax, leading to the downwards slope. 

Tax is one solution to inequality - it redistributes income within a population. 

Comments

Popular posts from this blog

Income elasticity of demand (YED)

    Income elasticity of demand (YED)         % D QD/% D Y             Income elasticity of demand (YED): the responsiveness of the quantity demanded of a good to changes in consumer income. YED allows us to work out which goods are inferior, luxury and normal. When YED > 1 or <-1, demand is elastic. When YED is between -1 and 1, demand is inelastic. When YED < 0, goods/services are inferior. This means as income rises, demand for these goods decreases. (e.g. bus tickets) They vary inversely with income. When YED < -1, goods are very inferior (e.g. own-brand labels, cheap cuts of meat). When YED = 0, demand for the good is independent of income. When YED > 0, goods/services are normal. Demand for these goods vary directly with income, and the state of the economy. When YED is between 0 and 1, goods/services are necessary. When income increases, demand for these goods go up a proportional...

The Philips curve

The Philips curve  The Philips curve suggests a tradeoff between unemployment and inflation - to decrease unemployment, inflation has to rise. This creates a conflict between two macroeconomic objectives - targeting inflation at 2% (in the UK) and decreasing unemployment. 

3.1.3 Demergers

Demergers   A demerger is the breaking up of a firm into separate firms.  e.g Sports Direct selling off Dunlop in 2016. PepsiCo splitting off foods businesses (KFC, Taco Bell, etc.) into a separate corporation, Yum Brands. Later Yum Brands demerged into Yum China and Yum Brands. Reasons for demergers Diseconomies of scale - the opposite of economies of scale, where average costs begin to rise as output increases. May occur due to it being difficult to retain control on the expanding business - principal-agent problem may arise. Also less co-operation by employees who feel more alienated and as a result less productive - they feel less of a connection to the business.  May also be hard to co-ordinate and communicate between locations and employees when a firm is large. Miscommunication can again lead to costs rising.  To focus on core businesses to streamline costs and improve profits. The firm may have expanded into different markets and expe...