Income vs wealth
Income is the flow of money, whereas wealth is a stock concept.
Income is the money earned over a set period of time, e.g wages, rental payments, dividends and interest.
Wealth is the value of one's assets, e.g savings, shares, bonds, pension, property and the value of physical goods.
NB: transfers like gifts, etc. are additions to wealth, not income, and increase the value of assets (capital gains)
Wealth is a lot harder to calculate in monetary terms than income, so this makes taxing income a lot easier, and is why we have an income tax. Taxing wealth could result in people moving wealth abroad to avoid the tax.
Another reason that taxing income works better is that taxing wealth makes it seem to people that they are losing something that is already theirs, whereas because income is taxed before people receive it, people are not as resentful.
Taxes paid for wealth include inheritance tax and capital gains tax (a one off payment when there is a visible change in one's wealth)
Both wealth and income are good indicators of living standards, and give us an idea of the amount of inequality in a country.
They are positively correlated:
- If you have a lot of wealth (e.g land), then this is likely to increase your income further (e.g through rental income)
- If you have a higher income you are adding to your wealth at a faster rate.
NB: even if all incomes increase by the same percentage, inequality increases, as higher incomes receive a larger wage increase, so are adding to their wealth more quickly. Therefore, both the income and wealth inequality gaps widen.
A small percentage of the richest in an economy usually hold the largest percentage of wealth. For example, the richest 20% of the population in the UK hold over 60% of the wealth.
Causes of inequality
Causes of income inequality:
Factors which affect productivity:
Qualifications/education - certain qualifications are in more demand than others, as it is harder to get them/they require more education, so these jobs have higher wages. Those who rely on benefits tend to have lower incomes.
Experience
Hard work/long hours
Genetics/upbringing - for example, IQ, natural talent and ambition. Maybe even hard work is genetic.
Factors which do not affect productivity:
Age
Distribution of assets - for example, rental incomes.
Economic growth
Geographic location - full-time workers in London/SE get paid more on average than those in NI/NE.
Tax and state benefits (or lack of) - the more progressive the income tax, the less income inequality there is.
NB - as wealth is harder to be taxed it is a lot easier to reduce income equality this way.
Tax and state benefits (or lack of) - the more progressive the income tax, the less income inequality there is.
NB - as wealth is harder to be taxed it is a lot easier to reduce income equality this way.
Causes of wealth inequality:
Distribution of assets and thus distribution of capital gains - assets tend to increase in value more quickly than income rises.
Incomes - shares, etc. often earn a person income in dividends, money which can be reinvested to earn the person more wealth. This widens the gap between them and someone who has little wealth in the first place.
Propensity to save - as people with more money are more likely to save it, it is not put towards consumption and is lost from the circular flow. So no-one else benefits from it.
Age
Inheritance
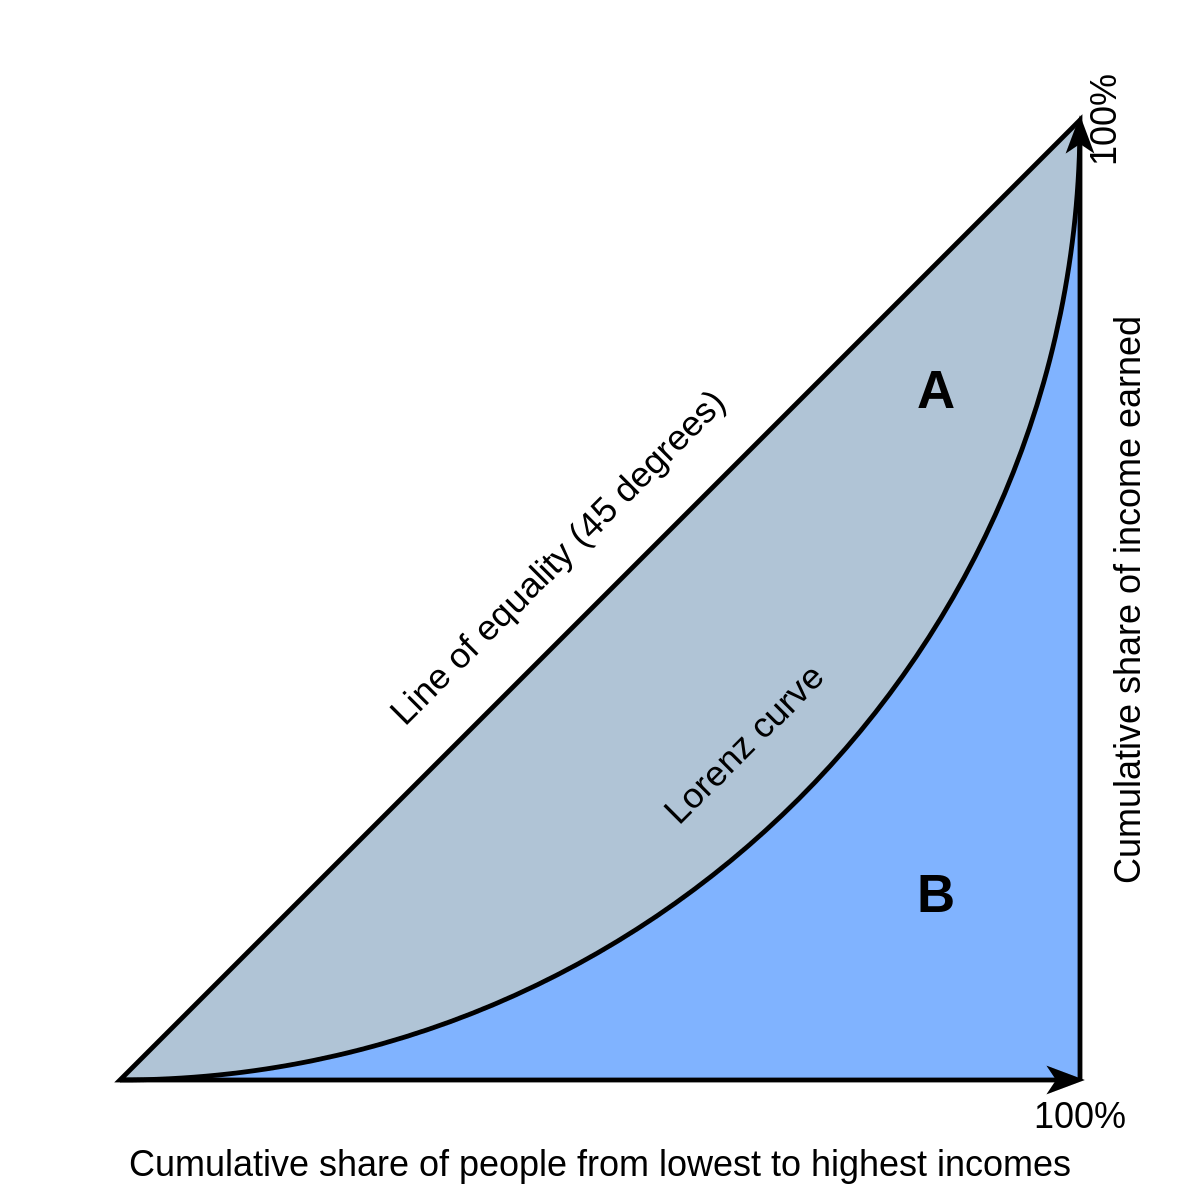

Lorenz Curve and Gini Coefficient
The Lorenz Curve illustrates the distribution of incomes in a country. The Line of Equality represents a country where there is perfect equality - each member would receive the exact same income. The closer the Lorenz Curve is to the Line of Equality, the higher the income equality of that country. The further away from the Line of Equality, the lower the income equality.
The Gini Coefficient indicates how unequal a society is. It indicates how far the Lorenz Curve is from the Line of Equality. It is good for comparing several countries to one another as it is quantitative, but doesn't give as much information as the Lorenz curve does, as it leaves out the distribution of income. It is calculated using the above formula.
G = A/A+B
It always lies between 0 to 1, where 0 is perfect equality, where everyone gets the same amount, and 1 is perfect inequality, where one person has all the income and everyone else gets nothing.
Impact of economic change and development on inequality

The Kuznets Curve (above) shows that pre-industrial countries are originally at low levels of inequality as all have equally low incomes. As development occurs, income inequality rises as a result as people move from low-productive agriculture to the more productive industrial sector - there is a rural-urban gap.
As countries become even more developed however, this gap is narrowed as a social safety net (benefits, pensions, etc.) is put in place.
Significance of capitalism for inequality
In a capitalist, free-market economy, inequality is inevitable as those who are higher-skilled and more productive are paid more than those who are less so, proliferating income and so wealth inequality. These inequalities incentivise individuals to become more productive and enjoy a better standard of living, fuelling further economic growth.
Property rights also increase wealth inequality, as those who acquire more land/assets than others earn more and more than those who have less wealth, and this kind of inequality is harder to remedy as it is not based on productivity (those with more wealth are often born into it), and it is harder to tax wealth.
Comments
Post a Comment