Exchange rates
An exchange rate is the value of one currency priced in terms of another.
Floating exchange rates
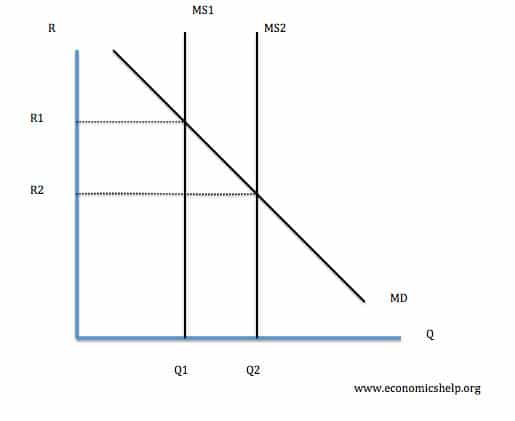
A floating exchange rate works in a similar way to normal supply and demand expect that the Bank of England controls the supply so it is independent of the XR and vertical.
Floating exchange rates are dependent wholly on the market forces of supply and demand.
Demand for £s could increase for example if:
- demand for British exports rise
- there is speculation that it will appreciate in the future
- international investors want to store money in the UK economy e.g. in UK government bonds or UK shares.
- increase in the base interest rate leading to 'hot money' flowing into the economy.
- increase in inward flows of foreign direct investment (FDI) into the UK.
- high confidence in the UK economy.
The increase in the 'price' of £s is called appreciation.
Demand for £s could decrease if the opposite of the reasons above happens. The fall in the 'price' of £s is called depreciation.
Fixed and managed semi-fixed exchange rates
Fixed exchange rates are where a government actively maintains a specific exchange rate for its currency. This is called 'pegging' a currency as it is metaphorically 'pegged' to another. There are different ways this can be done.

One way of pegging a currency is by using the base interest rate. If there is an increase in demand for £s then the government can reduce the base interest rate and 'hot money' will flow out pulling demand for £s back down again. If demand for £s falls then vice versa. The problem with that is you then cannot use your base interest rate to control inflation.
Another way of pegging a currency is by the government buying and selling reserves of its own currency for foreign currency reserves. This pushes demand back to the pegged equilibrium.
The other way the currency can be pegged is by having fixed capital flows. This means that people cannot freely trade the currency and exchanges are controlled by the government so effectively the demand curve cannot move. As a result the XR stays the same. The problem with this is it restricts FDI and can trap money in the country which can cause asset bubbles (e.g. China's property market).
China - the Chinese Yuan is semi-fixed against the USD using capital controls. It is also maintained by the acquisition of the USD by the Chinese economy/gov. If the Yuan appreciates China can buy USD to restrict supply and make the USD appreciate relative to Yuan, and vice versa if Yuan depreciates too much. Likewise, China could hypothetically reduce its base interest rate so hot money flows out but it doesn't do this as then it wouldn't have monetary control. Capital controls have caused asset bubbles in China. Assets are the accumulation of wealth, and when one has a lot of wealth in China, capital controls mean that they are unable to invest it elsewhere, only in China. As a result, there is greater internal demand for Chinese property, stocks, etc. leading to prices to spiral upwards and asset bubbles to occur. Where China to suddenly remove capital controls, it is highly likely these bubbles would burst as demand drops and prices crash downwards.
Over time, the Chinese gov is revaluing the Yuan to a higher rate against the Dollar (closer to the floating rate equilibrium)
The WTO would be unhappy with countries pegging their currencies at low rates. However, lower-income countries are allowed to peg as this increases international investment/trade in those counties. Additionally, if their currency depreciates, this won't affect many other countries, whereas if the same happened with higher-income countries, there would be a much larger effect.
Semi-fixed exchange rates work in the same way as fixed exchange rates except that they are pegged within a range rather than to an exact equilibrium. The government will only intervene to keep it within bands.
Impact of changes in exchange rates
On the current account:
When currency appreciates, its exports become less competitive and vice versa.
e.g if the Yuan appreciates against USD, less Chinese goods can be bought for the same number of $.
Imports become more competitive when the currency appreciates.
X prices increase, quantity of X sold decreases.
M prices decrease, quantity of M sold increase
Depending on elasticities, either X rev > M rev or vice versa.
If X and M are inelastic, then change in prices is proportionally greater than change in quantity sold. In this case, export revenue > import revenue and the balance of trade becomes more positive. The economy moves further into trade surplus and thus current account surplus.
If X and M are elastic, then changes in sales is greater than proportionate to price changes, so X revenue is less than M revenue, and the country moves further into current account deficit.
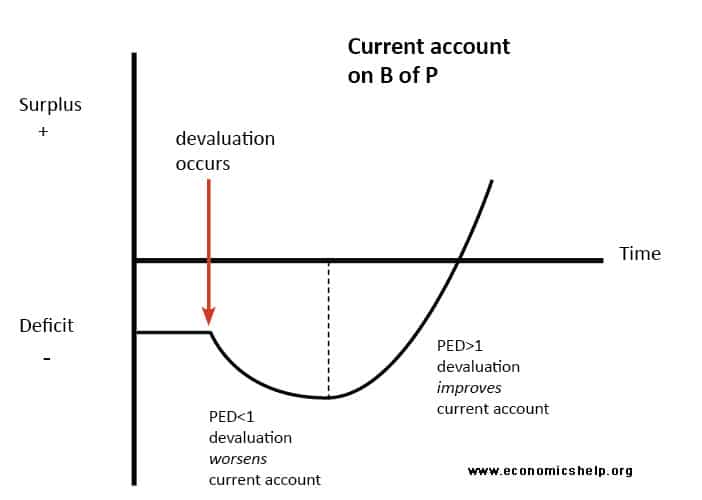
The J Curve
The above principle is graphically depicted through the J Curve. This curve assumes that the Marshall-Lerner Condition holds. This states:
A depreciation/devaluation of the exchange rate will lead to a net improvement in the trade balance provided the sum of the PED for exports and imports > 1.
When the sum is < 1, a depreciation/devaluation will lead to net deterioration.
Because in the SR, demand is thought to be inelastic, a depreciation leads to a country increasing its deficit. As time goes on, and PEDs become more elastic, the rate at which the deficit increases decreases, until PED of imports + exports = 1. Here the curve reaches a minimum. After this point, PED of imports + exports >1, and the curve slopes upwards as the country moves further into surplus.
Effects of XR on economic growth:
A floating XR can act as an automatic stabiliser during downturns in the business cycle. During a recession, demand and FDI flows decrease, meaning floating currencies depreciate. This makes the X of those countries more competitive, and as the J curve shows, this tops the balance of trade towards a surplus, pushing AD back out as (X-M) is a component. This stabilises or at least mitigates a fall in AD.
Effects on inflation:
Changes in the prices of imported goods and services has a direct effect on CPI as imports make up 17% of UK basket (2010 ONS data). So if currency depreciates, M become more expensive and inflation may increase.
Many commodities are priced in dollars so if the £-$ XR depreciates, the price of commodities for UK firms will increase, and this leads to cost-push inflation. Likewise if the $ appreciates and £ doesn't as much.
Effects on employment:
Industries that produce very price elastic goods and where a high % of total output is exported are very sensitive to XR fluctuations and employment here is also sensitive to XR as a consequence.
A higher XR can have a negative multiplier on the economy as demand for X decreases. If imports take up a permanently higher share of the domestic market also (as they may be cheaper compared to domestic goods now), there may be permanent job losses.
XR appreciation can lead to slower growth of real GDP as rev of M > rev of X in LR (but dependent on elasticities)
Effects on FDI flows:
A weaker currency may detract investors and mean for less FDI inflows, because the investment may be seen as more risky.
In Zambia, switching to a floating XR led to less investment as the country primarily produce commodities, meaning a lot of volatility in the XR. This again detracts FDI as increases uncertainty.
Having a weaker currency is also detrimental when it comes to debt - Zambian debt in USD increases in Kwacha as depreciation occurs.
Comments
Post a Comment